

Commentary by:
Unprecedented Whole Exome Coverage Uniformity using ResolveDNA® WGA and Twist Human Core Exome Panel
Primary Template-directed Amplification (PTA) is a novel and accurate single-cell Whole Genome Amplification (WGA) method for the genomic analysis of single cells and ultralow input DNA samples. When paired with Twist Human Core Exome panel, ResolveDNA PTA Whole Exome Sequencing method generates high quality data with exome target coverage above 97%.
Introduction
Despite significant advances in genomics analysis methods, hundreds of nanograms to microgram quantities of DNA are still needed for many Next Generation Sequencing (NGS) sample preparation workflows. When working with single cells or other limited-input samples, picogram quantities of genomic DNA have to be amplified through whole genome amplification (WGA) methods to provide the desired amount of input material. Challenges of single cell WGA include low genome coverage, poor coverage uniformity, allelic skewing and cell-to-cell variations. Primary Template-directed Amplification (PTA) is a novel, isothermal method used in ResolveDNA WGA which overcomes these challenges with superior data quality1.
Combining the revolutionary amplification performance with whole exome enrichment methods enables the screening of all known coding genes within an individual cell. When used with whole exome panels for whole exome sequencing (WES), the high genome coverage and coverage uniformity of ResolveDNA translates to higher exome target coverage, better coverage uniformity, and unprecedented variant calling sensitivity and specificity. This enables researchers to discover new biomarkers while exploring exonic regions of interest with high confidence.

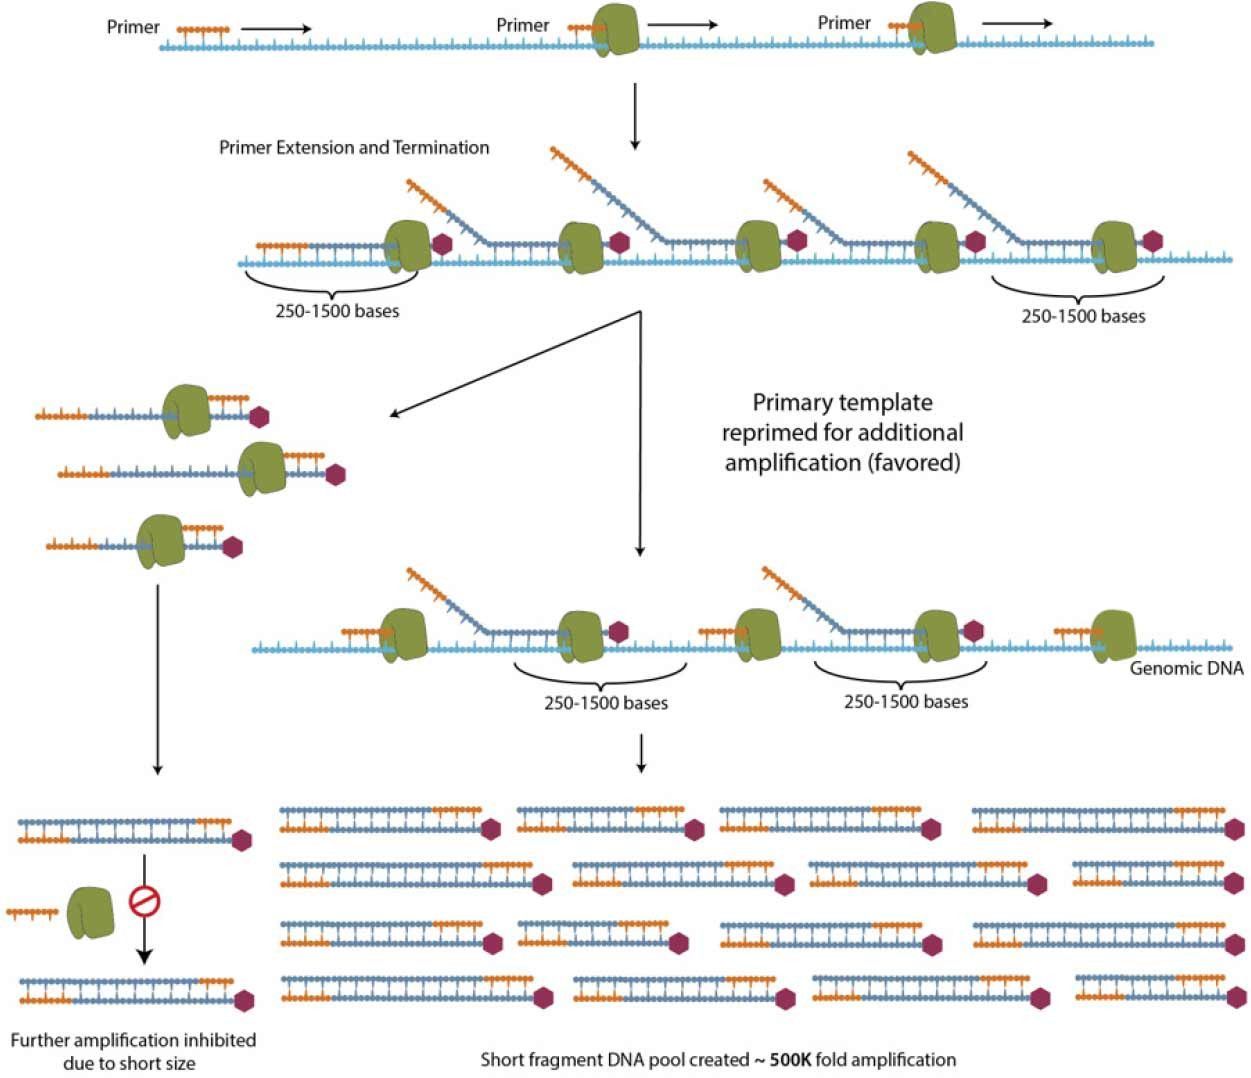
Figure 1. Schematic of PTA mechanism. ResolveDNA WGA is a random-primed, isothermal polymerase driven reaction that provides unbiased amplification by attenuating the size of daughter amplicons and consequentially re-directing primers to the primary template.

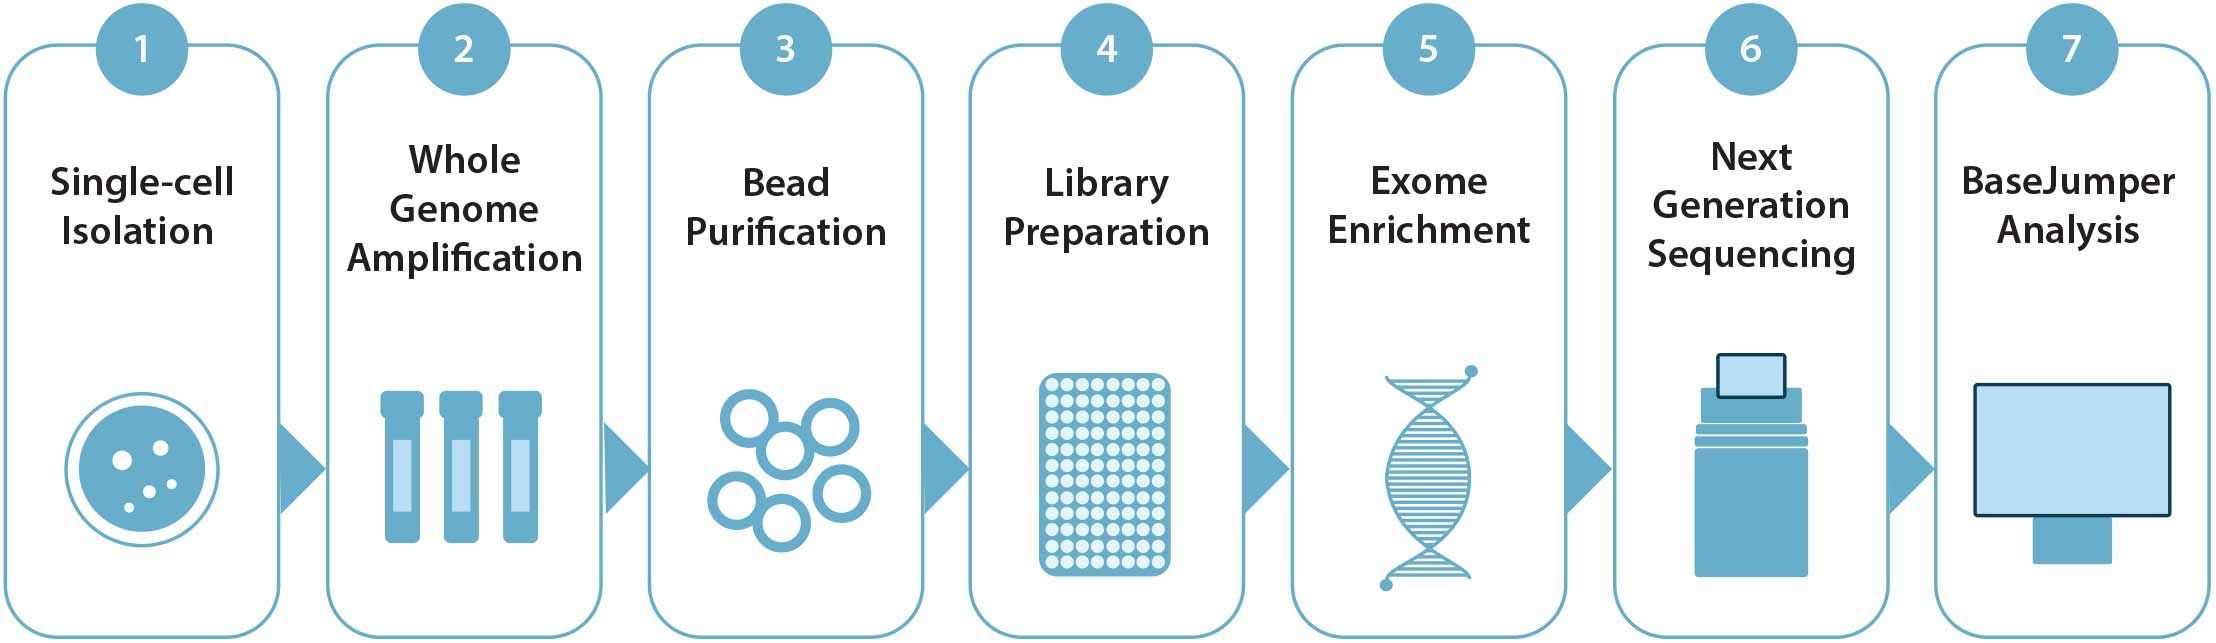
Figure 2. BioSkryb Genomics ResolveDNA paired with Twist Biosciences Exome enrichment Workflow: Isolated single-cells undergo a workflow that integrates Primary Template-directed Amplification with library preparation of purified amplification products, follwed by exome enrichment, sequencing, and analysis with BaseJumper™ software.
Twist BioSciences Exome Enrichment
Twist Human Core Exome is an exome panel consisting of 190,213 non-overlapping regions covering 34Mb of Consensus Coding Sequencing (CCDS) or 99% of ClinVar variants. The regions were defined using the most current January 2017 freeze of the hg38 build. High fidelity double stranded 120 nt DNA probes were synthesized using Twist Bioscience's silicon-based technology. A quality control step assessing probe representation and uniformity is used to ensure uniform enrichment of target regions. The Twist Human Core Exome panel boasts a high ontarget rate and coverage uniformity with more than 85% of bases exhibiting >30x coverage.
In this Tech Note, we present data from the single cell PTAWES workflow using ResolveDNA WGA kits and Twist library preparation and whole exome enrichment kits (Figure 2). As both PTA and Twist Human Core Exome panel are known for high genome coverage, outstanding coverage uniformity and allelic balance, we saw high quality exome coverage, uniformity and allelic balance data from ResolveDNA Twist WES.
Materials and Methods
Primary Template-directed Amplification was conducted on single NA12878 cells collected and stained with Calcein AM and PI dye for live cell sorting. The sorted Calcein AM positive and PI negative single cells in 96 well LoBind plate were then processed with PTA using ResolveDNA WGA kit (PN100068 or PN100136)2. PTA product was purified with ResolveDNA Bead Purification kit (PN100121 or PN100182). Purified PTA products were quantified with Qubit HS dsDNA Assay kit (ThermoScientific) and DNA size profiling was performed with D5000 HS Screeentapes on Tapestation 4200 (Agilent Technologies).
Library Preparation and Target Enrichment were prepared in duplicates with Twist Library Preparation EF kit (PN100253) using 50 ng PTA products from six single NA12878 cells and one 100 pg gDNA control. A bulk control library was also prepared using 100 ng gDNA as input for each duplicate run. PTA products were fragmented for 4 minutes, much shorter
than the recommended 22 minutes, due to the small size of PTA amplicons (<10kb). As a control, the intact gDNA was fragmented for 22 minutes as suggested by Twist protocol. Target enrichment was performed using 100 ng libraries with Twist Human Core Exome kit (PN101217) following the manufacturer’s instructions.

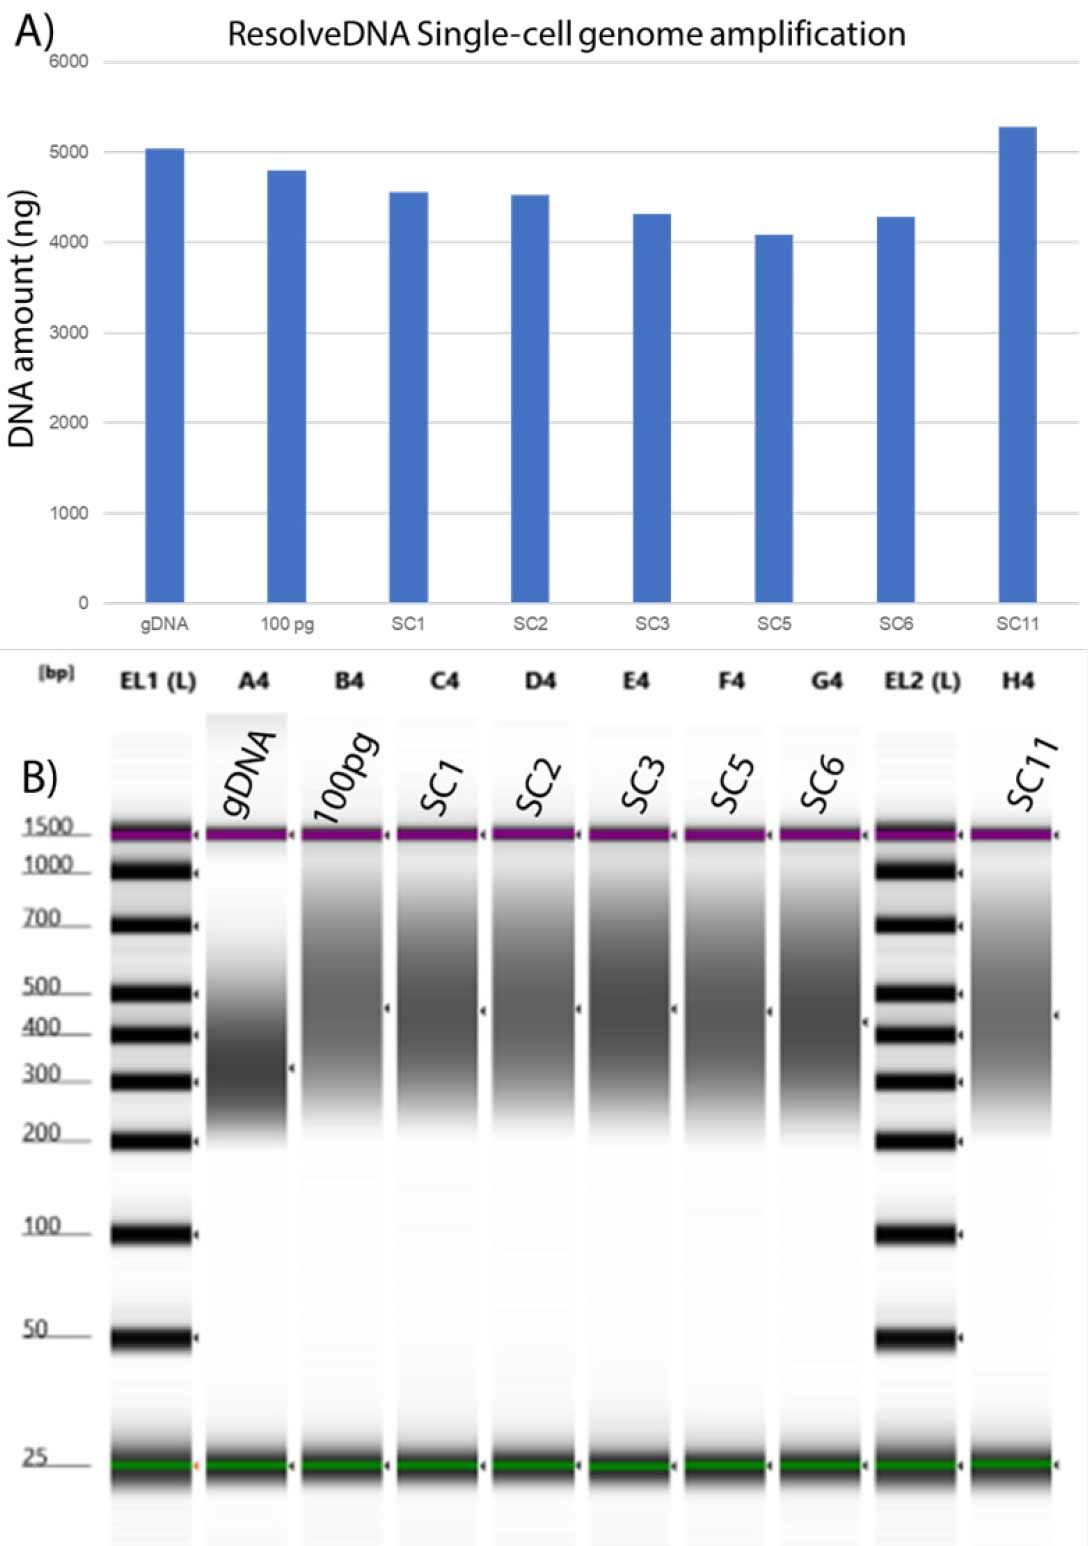
Figure 3. Single NA12878 cells generate robust amplified genomes. In (A) individual cells generated >1000 ng of amplified DNA from each cell. Libraries prepared (B) using the Twist Biosciences library preparation kit yield exome enrichment libraries with an average of ~450 bp.
Sequencing and Data Analysis was completed on libraries made from six single cell PTA products which were pooled and loaded on a MiniSeq at 2.2 pM. Approximately 5 million PE 75 bp reads were generated per library. Preseq count and ChrM metrics were called and compared to historical data for quality assessment. Enriched libraries were pooled and sequenced on NovaSeq using S4 flowcell. Approximately 40 million PE 150bp reads were generated per library. After demultiplexing and quality trimming raw reads were aligned to the hg38 reference genome using BWA-MEM. Duplicates, reads with mapq<20 and unmapped pairs were filtered out using SAMtools. Enrichment metrics were assessed using Picard. Variant calling was carried out using the GATK method (v4). All data was downsampled to 40 million reads per library

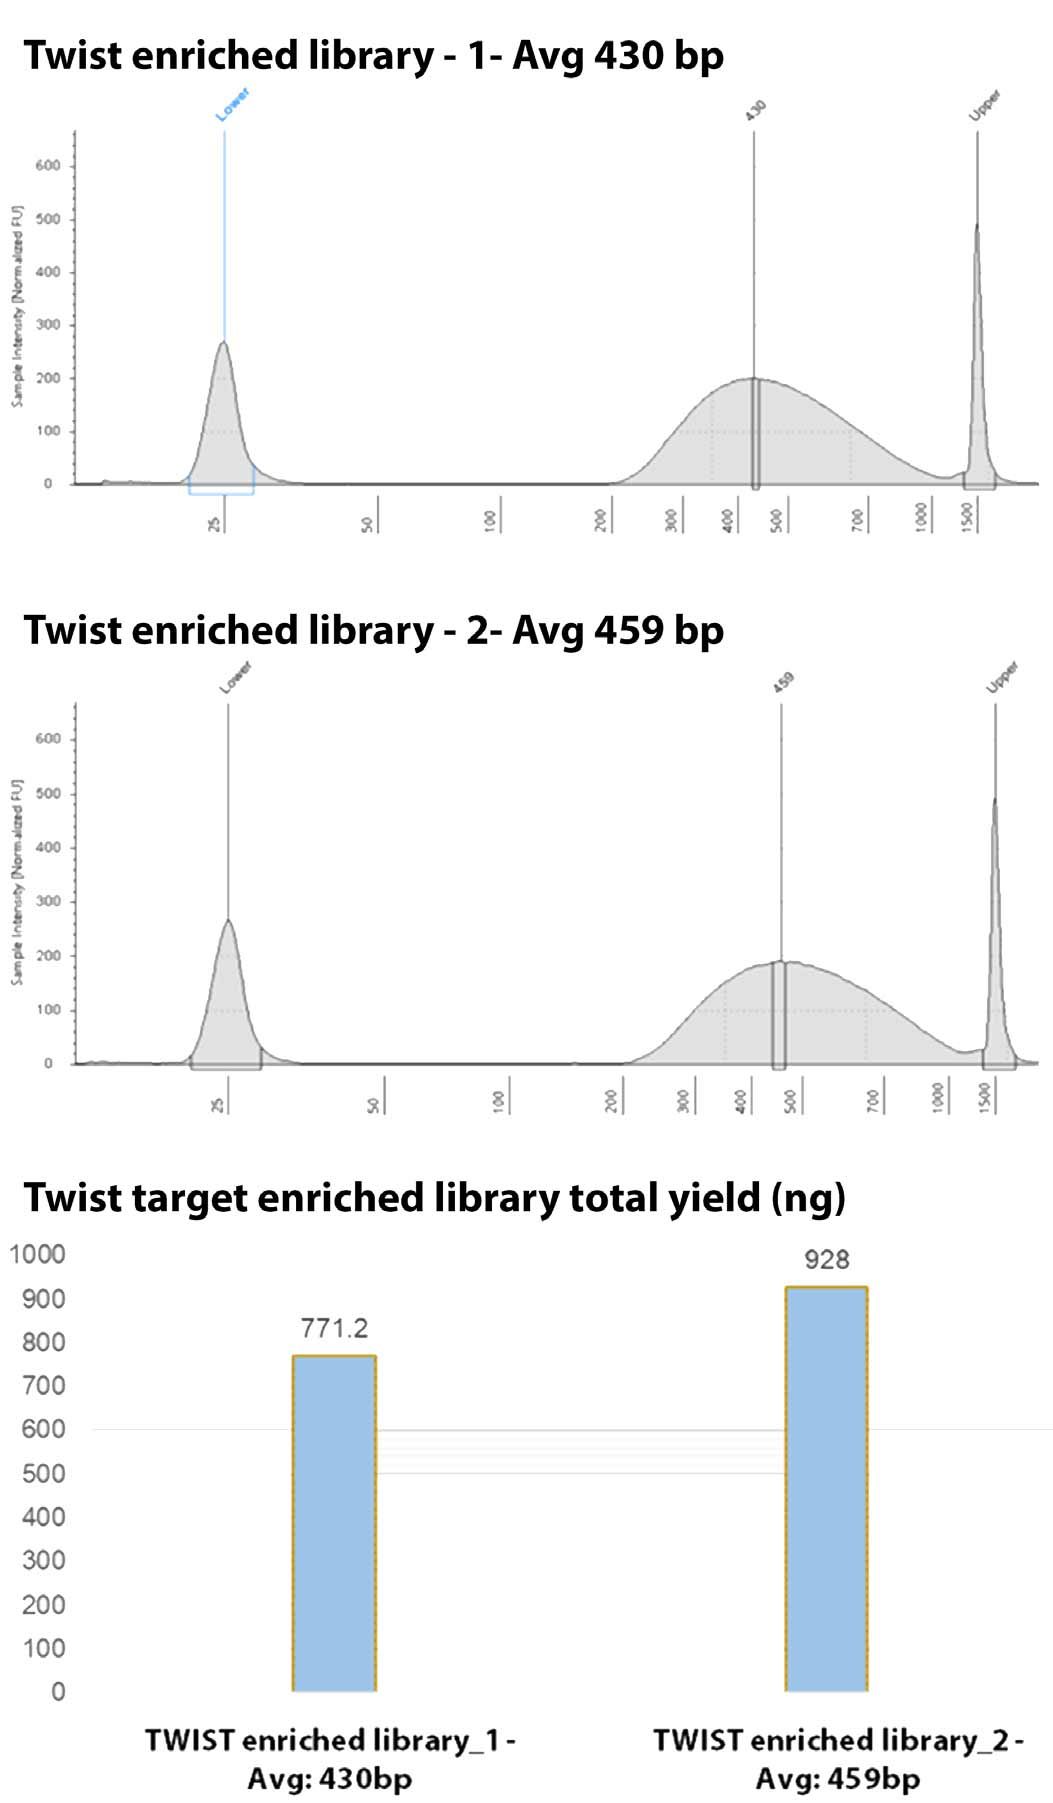
Figure 4. Twist Biosciences exome enriched single-cell amplified genomes. Enriched samples again demonstrated adequate fragmentation and insert size for downstream NGS analysis. Total insert size after purification and adaptation using the stubby adapters ranged from 430-460 bp with a yield of greater to 750ng total DNA.
Results
Single Cell PTA Quality can be assessed by PTA yield, DNA size profiling and low pass sequencing metrics. Single cells used in this experiment generated higher than 1000 ng of DNA, indicating a successful amplification (Figure 3). The size of amplified DNA ranged from 100 bp to 10 kb and peaked between 800 bp to 1.5 kb, matching historical data for high quality PTA products.
Libraries from these high quality PTA products ranged in average size from 408 bp to 466 bp, optimal for whole exome data analysis. These libraries were sequenced on a MiniSeq alongside bulk DNA control for ~5 million PE 75 bp reads per cell/sample. All twelve cells generated PreSeq count higher than 3.9 Gb and ChrM lower than 1%, demonstrating high data quality from the perspective of library complexity and cell lysis.
Twist WES enrichment demonstrated effective creation of pooled libraries. Two pools were created, both with an average insert size of ~250-300 bp (~430-450 bp including adapters), as seen by the Tapestation analysis (Figure 4). Enrichments yielded similar fragment size from the library preparation indicating little if any skewing or sample loss during the enrichment process. In addition, the enrichment yielded significantly greater product than required for a single sequencing run. This allowed for library preservation and pool storage for follow up analysis.

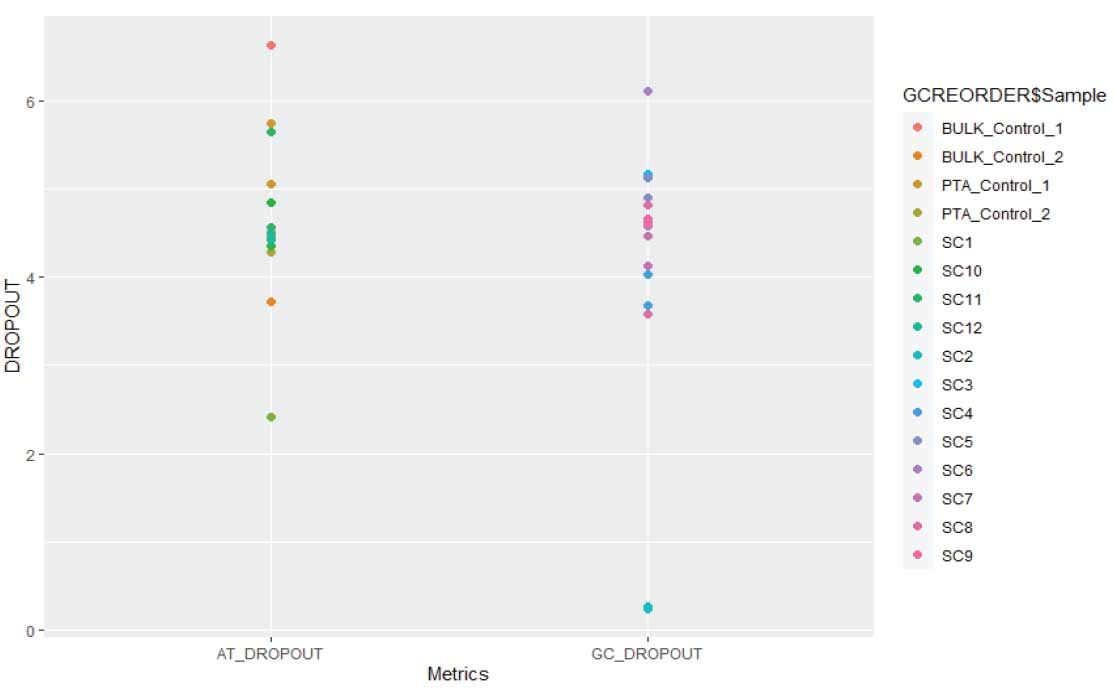
Figure 5. SIngle NA12878 cells demonstrate low GC bias: Analysis of both AT and GC regions of the genome demonstrate similar alleleic dropout rates. We found the average dropout rate in single cells were comparable, 4.5% vs 4.7%, respectively, demonstrating GC rich and AT rich region are uniformly enriched with minimal GC bias.
Twist WES Coverage and Uniformity.
After 8-plex whole exome capturing, the captured libraries were sequenced on a NovaSeq for ~40 million PE 150bp reads. We first determined if the coverage variation was a function of the base content using the GC content to determine allelic dropout (Figure 5). The average GC_DROPOUT and AT_DROPOUT in single cells were comparable, 4.5% vs 4.7%, respectively, suggesting a both GC rich and AT rich region are uniformly enriched with minimal
GC bias. The average Fold 80 Base Penalty of the 12 single cells is 2.39, with a tight range between 2.29 and 2.76. Notably, scPTAWES using Twist Human Core Exome panel achieved an average of 98% of the bases covered at 1x and 92% of the bases covered at 10x or higher (Figure 6B).

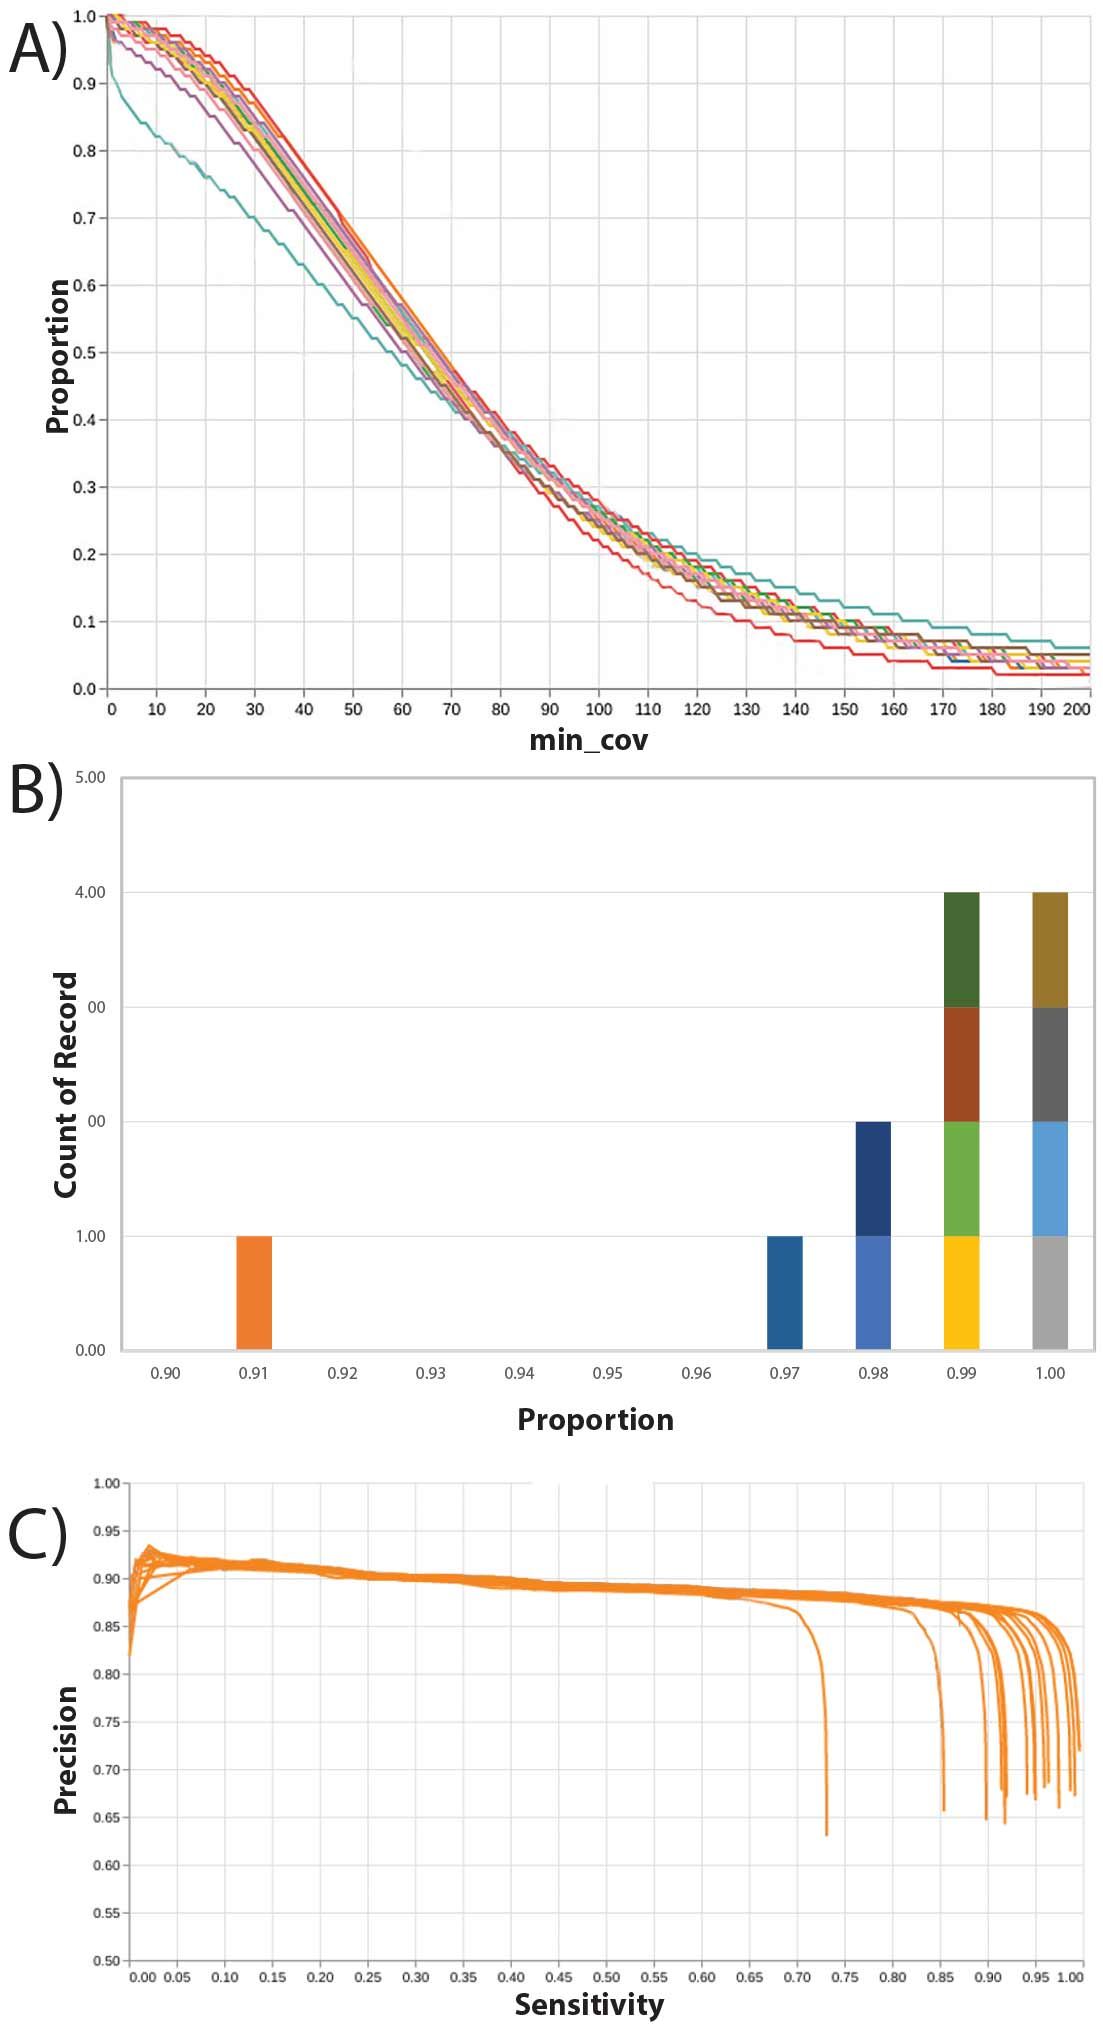
Figure 7. Genomic coverage profile of PTA-amplified DCIS/IDC and normal breast single cells. The proportion of the genome that has the indicated coverage is shown for the primary single cells (blue lines) relative to control GM12878 lymphocytes (orange). Most patient cells exceeded 95% of the genome covered by at least one read.
Heterogeneity revealed: oncogenically-relevant CNV and SNV diversity in DCIS
The robust sequencing metrics and genomic coverage uniformity obtained from coupling PTA single cell genome amplification with Illumina DNA Prep provided confidence in copy number and single nucleotide variation. We employed Ginkgo and DRAGEN algorithms to call CNV and SNV, respectively. Even among a sample set of 31 individual cells, we saw remarkable intratumoral CNV diversity (Figure 8). Regional chromosome loss coincided with tumor suppressor genes known to be influential in DCIS (3), including retinoblastoma 1 (Rb1) and p53.
In addition, loss of the chromosomal region encompassing BRCA2 was observed (13q12.3), suggesting a contribution of DNA repair defects contributing to neoplasia. In addition to these prototypical DCIS chromosomal alterations (3), we importantly identified a cell harboring multiple large copy number losses (Chr. 2, 6, 8, 9, 12, 13, 16, 17) exemplifying the marked clonal heterogeneity observed within this patient tumor sample, but of which the consequences on tumor suppressor loss-of-function remain to be determined.
A fundamental power of single cell analysis is the ability to delineate cell lineage. In this specific patient tumor, the majority of single cells did not have any apparent gross CNV (Figure 8B).

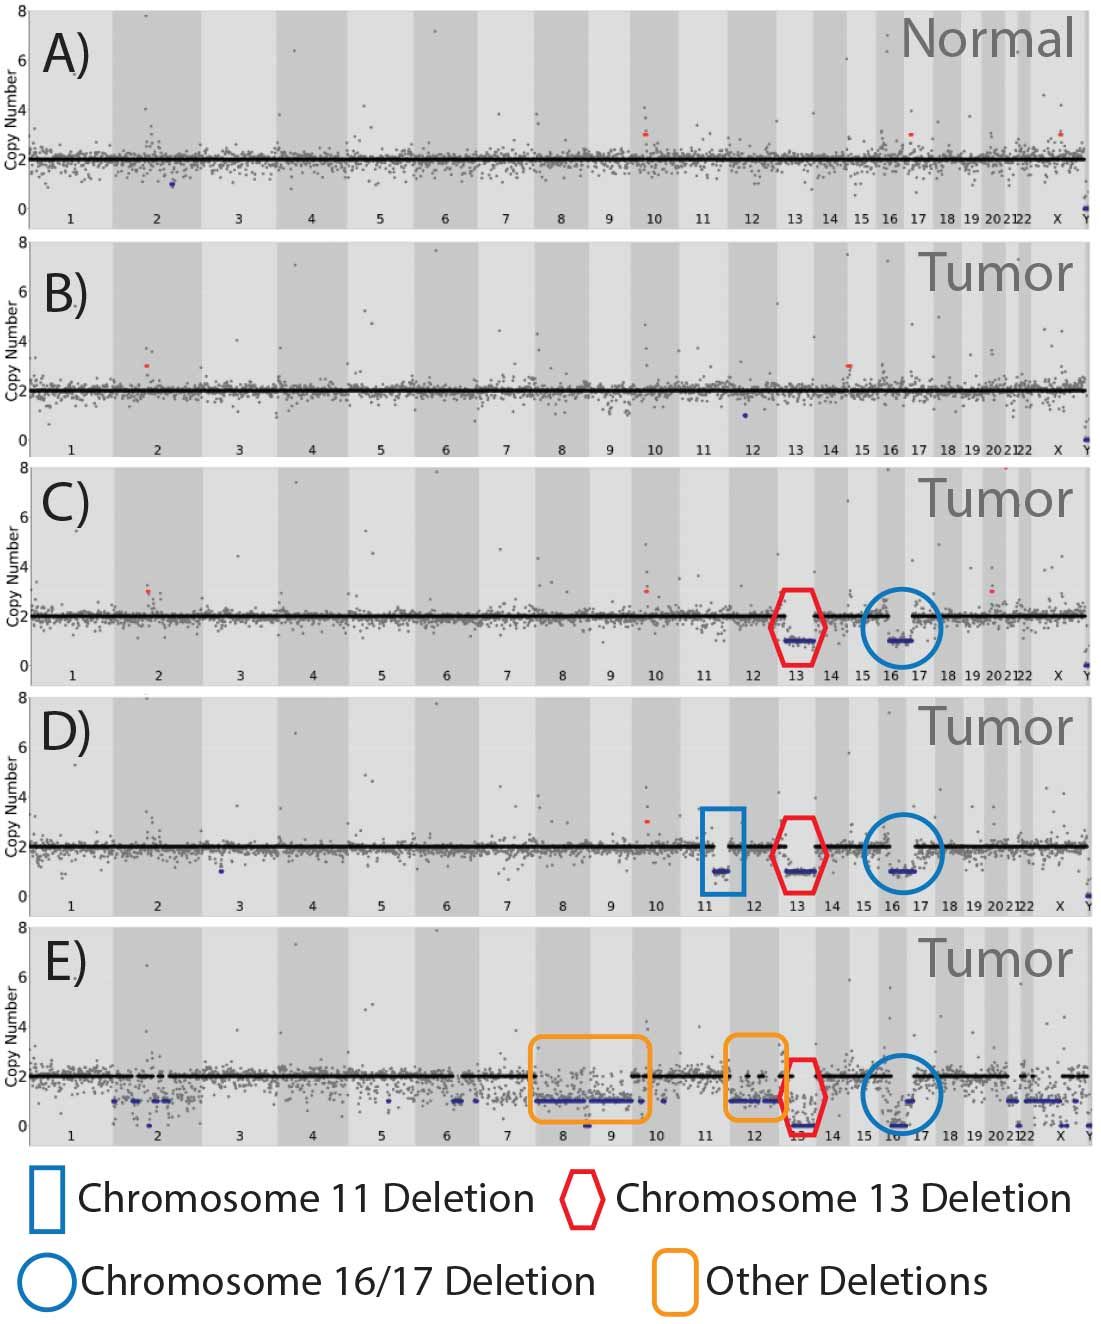
Figure 6. Coverage uniformity, sensitivity and specificity of BioSkryb Genomics ResolveDNA paired with Twist Biosciences Exome. In (A) coverage of libraries prepared from isolated single cells after ResolveDNA WGA, llibrary preparation, exome enrichment, and sequencing demonstrated 98% exome coverage at 1 read/base (1X), greater than 93% at 10 reads/ base (10X), and 85% at 30 reads/base (30X). Of the cells analyzed 11/12 had coverage (B) greater than 97% bases with 1 read/base (1X). This translated to 11/12 samples with SNV sensitivity between 82-95% at a precision of 86% (C).

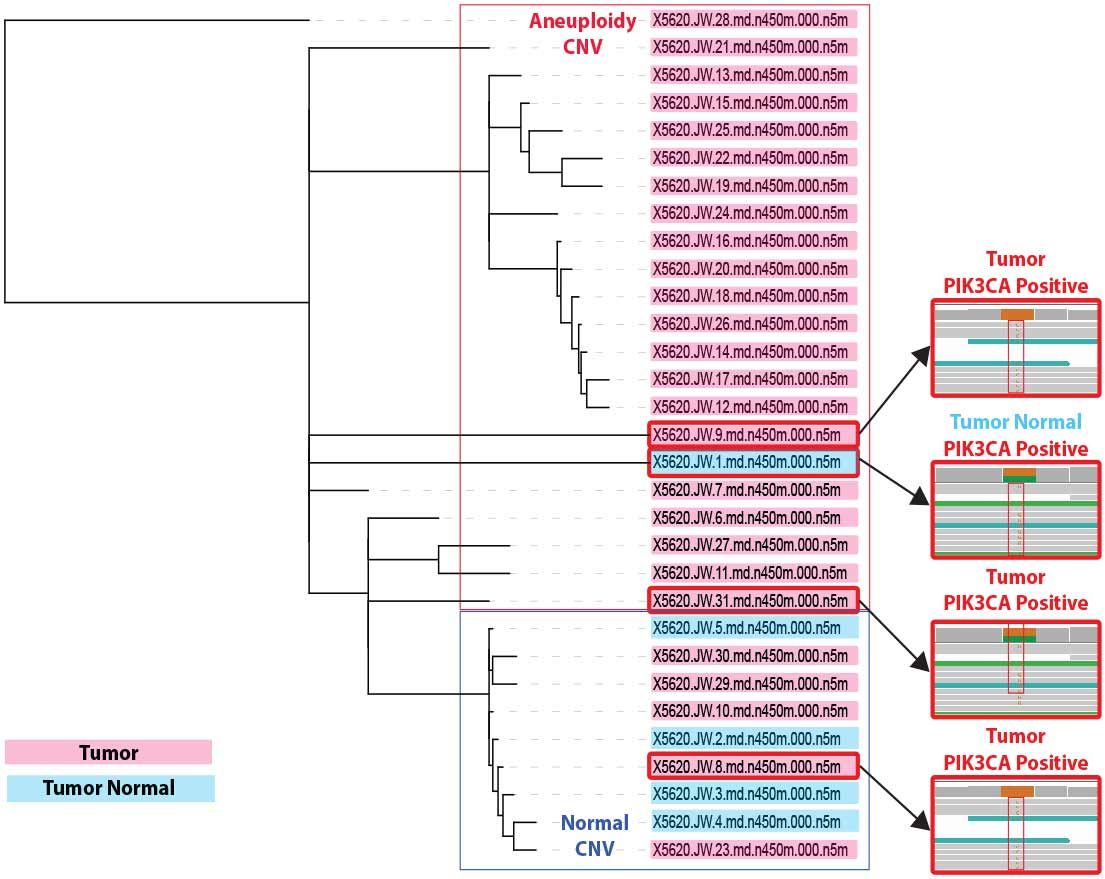
Figure 9. CNV and PIK3CA clonal analysis. A phlyogenetic lineage structure was derived from the DCIS patient cell CNV dataset, onto which we layer PIK3CA H1047R mutation data. DCIS/IDC tumor cells are shown in pink; cells from the ipsilateral normal breast control sampling are presented in blue. Read structures for PIK3CA H1047R are shown (right) and linked to the corresponding CNV clade for that cell.
A second class of single cells contained both Chr. 13 and Chr. 16/17 loss--representing ~20% of the cells (Figure 8C).
A third cohort of cells (~25%) contained these same two CNV alterations plus loss of 11q, another frequently lost region in DCIS (3). These data suggest different clonal populations, defined by CNV, within the tumor milieu (Figure 9) that would not be discernable by bulk sequencing.
Concurrently with CNV analysis, we performed a candidate gene screen for SNVs in genes known to be influential in DCIS (and in breast cancer in general). From this initial screen we identified a H1047R missense mutation in the kinase domain of the lipid kinase PIK3CA; a known activating mutation as well as a known hotspot mutation based on The Cancer Genome Atlas data (5). This change was identified in 4 single cells, 3 from the DCIS/IDC singulated tumor sample and in 1 cell derived from the ipsilateral normal breast control.
Intriguingly, we did not detect PIK3CA H1047R in the single cells with pronounced copy number. This suggests distinct mechanisms of oncogenesis. Some cells within the tumor proliferate uncontrollably due to loss of key tumor suppressor regulation, while in other single cells a missense mutation in a key signal transduction node affecting downstream MAPKmediated cell proliferation and AKT-mediated survival signaling is sufficient to drive unchecked growth.
The presence of the PIK3CA H1047R mutation in one cell derived from the ipsilateral normal breast control surgical resection raises the possibility that the tumor/normal boundary may have been breached during specimen collection. Alternatively, we may have identified a rare pre-malignant cell present in normal tissue. The results, taken together lead us to the belief that WGS with PTA will ultimately become diagnostic to determine the clonal architecture that will provide actionable data to clinicians.
Another parameter indicating high quality data is the percent of bases that have greater than 30X coverage. In this experiment, in the majority of the single cells, typically 85% of bases had >30x coverage, exceeding most known published results using other WGA and whole exome capture methods.
SNV Calling Sensitivity and Specificity
To investigate whether scPTA-WES maintained the high single nucleotide variants (SNVs) calling sensitivity and specificity, scPTA-WES data were analyzed using BaseJumper SNV calling software. scPTA-WES achieved SNV calling sensitivity above 90% and specificity above 90%.
Conclusion
- Typical zero target coverage of < 2%
- Higher than 85% of bases with 30x coverage
- High single cell exome coverage uniformity demonstrated by Fold 80 base penalty and GC/AT dropout rate
- Exceptional single cell SNV calling sensitivity and specificity
References:
- Gonzalez-Pena, V., et al., Accurate genomic variant detection in single cells with primary template-directed amplification. Proc Natl Acad Sci U S A, 2021. 118(24).
- BioSkryb Genomics, i., ResolveDNA Whole Genome Amplification Kit For high-quality single-cell and low-input DNA amplification, in www.bioskryb.com, B. Genomics, Editor. 2021, BioSkryb Genomics: Durham, NC. USA.


For more information or technical assistance: info@bioskryb.com
TAS-026, 01/2022